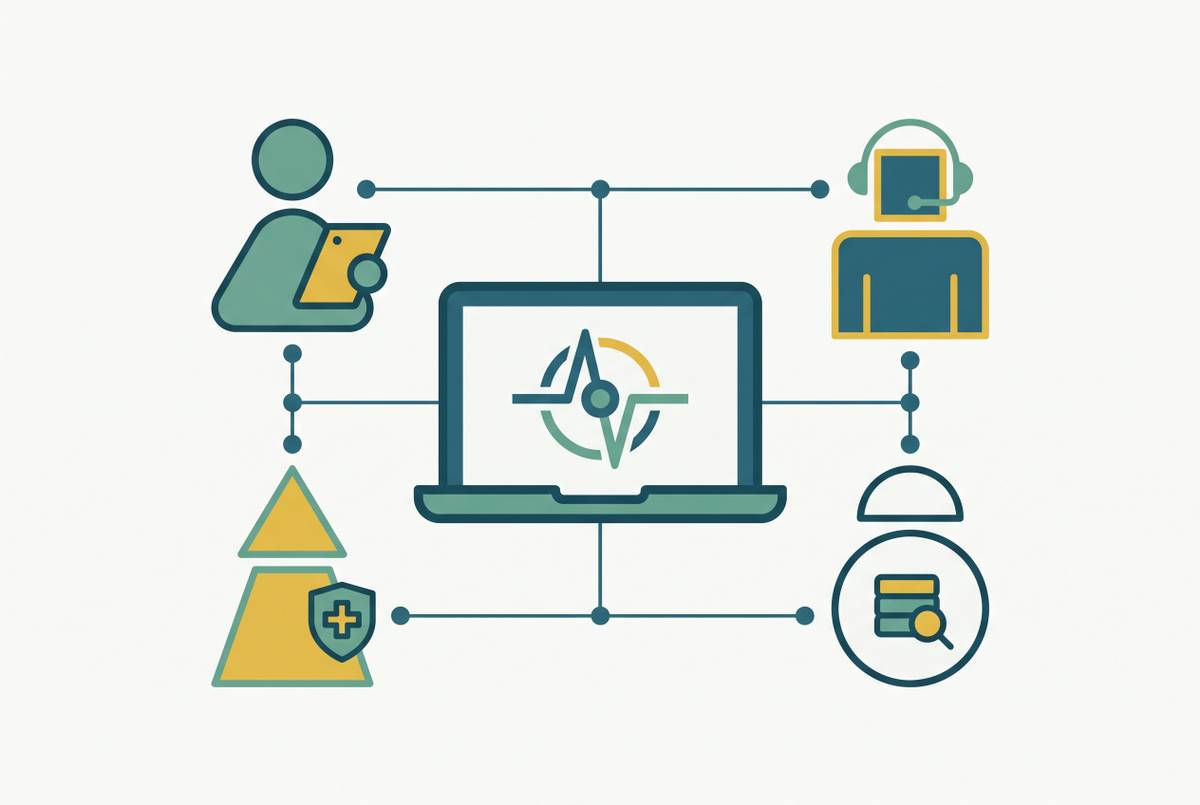
Performance Metrics for Telehealth Clinic Operations
Clinics need formal metrics across service, technical, and financial domains.

Telehealth is a permanent line of care delivery, and running a permanent line of care delivery without defined metrics, review cycles, and corrective levers is a management failure, not a minor gap. A channel this embedded can't be monitored the old way, through scattered provider complaints and the occasional billing exception that catches someone's eye. Clinic leaders who still treat telehealth oversight as informal are carrying real exposure: not measuring raises the risk of clinicians who disengage, patients who lose access to care they were promised, and a bottom line that quietly erodes. Those three outcomes are not random. They map directly onto the three performance domains, service, technical, and financial, that structure everything the rest of this piece covers.
Hybrid care has made this more urgent, not less. Virtual triage ahead of an in-person visit, remote monitoring between appointments, and scheduling that shifts patients across modalities all mean telehealth performance now touches the whole care operation. It now runs through the whole care operation, and it rarely gets quarantined or measured as a channel of its own. Regulatory conditions have also shifted in a way that makes sustained measurement worthwhile. The Consolidated Appropriations Act, 2026, signed February 3, 2026, extended most Medicare telehealth flexibilities through December 31, 2027. That window gives clinics room to build multi-year benchmarks for the first time, rather than measuring against rules that might vanish at the next funding deadline.
The three-domain structure that organizes telehealth measurement
Telehealth performance splits into three domains because each one can break for its own reasons, and a failure in one eventually drags the others down. Service performance covers whether patients and clinicians accept and want to keep using the channel. Technical performance covers whether the technology and connectivity actually hold up. Financial performance covers whether telehealth is contributing to the clinic's bottom line. A peer-reviewed KPI framework published in BMC Health Services Research in 2025, built through a formal Delphi consensus process among experts, arrives at a structurally similar grouping. The convergence means the three-domain split reflects expert agreement about how telehealth actually fails, not a framework one practitioner happened to like.
The domains are separable in practice, and that separability is the whole argument for tracking them individually rather than relying on one combined sense of "telehealth is going fine." A clinic can post strong patient satisfaction scores and still lose money on telehealth because of coding errors nobody caught. It can turn a profit on telehealth and still be grinding down its clinicians, who will eventually leave or stop participating. It can have satisfied clinicians and satisfied patients and still bleed visits to connections that keep dropping mid-session. None of these failures appears reliably in the others' numbers. A single dashboard metric, like total visit count, tells a clinic leader almost nothing about operational health. The sections that follow take the domains in order, starting with service, because it is the one most dashboards underweight and the one where failure spreads fastest to the other two.
Service performance: what clinician and patient satisfaction measure
Clinician satisfaction belongs first on this list, and most telehealth dashboards still treat it as an afterthought behind visit counts and revenue. The Telehealth.org framework lists it first among its five core metrics for a specific reason: without a good service experience on both sides of the screen, telehealth does not hold up over time. This is not a wellness check-in. A clinician who finds the platform clunky, who struggles to see or hear patients clearly, or who feels the technology is getting in the way of the actual clinical work, is a leading indicator of problems that will appear elsewhere later: visit quality that slips, staff who leave, and a platform that clinicians quietly start avoiding in favor of in-person scheduling wherever they can.
What should a clinician satisfaction survey actually ask? It needs to get at whether clinicians can see and hear patients without strain, whether connecting to a visit is simple or a recurring hassle, and whether the technology supports the clinical workflow or constantly interrupts it. The quality of the answers depends on more than the survey questions themselves. Clinicians need to understand why their input matters, trust that leadership will act on what they report, and find the survey easy enough to complete that it doesn't become one more task competing for their time. That same logic applies just as directly to patients.
Patient satisfaction surveys for telehealth need to ask about the technology experience specifically, not just overall satisfaction with the care received. Can the patient see and hear the clinician clearly? Is joining the visit straightforward or a source of friction before the appointment even starts? Technology failure is the most common source of telehealth-specific dissatisfaction, and a survey that only asks "how was your visit" will miss it. One more step matters for any clinic serving a mixed patient population: satisfaction data needs to be broken out by subgroup, whether by age, language, insurance type, or geography. An aggregate satisfaction score at a comfortable level can still be hiding a group of patients who consistently can't complete a visit without real difficulty.
Technical performance: the metrics that reveal whether the technology is working
Technical performance is where the infrastructure behind service quality either holds up or doesn't, and it's the domain most clinics ignore until something breaks in front of a patient. The BMC Health Services Research KPI study from 2025 identifies operationally meaningful technical indicators developed through its expert consensus process, including average waiting time to access service and the percentage of errors found in pre-call testing. The study does not set a specific maximum call abandonment rate or a maximum average connection time as a threshold. Each clinic has to define its own acceptable threshold and then track actual performance against it.
Call abandonment rate, the share of visits that patients or clinicians drop before the session starts or finishes, measures technology friction directly and is the clearest leading indicator that patient satisfaction is about to decline. Average connection time, how long it takes a session to actually establish once someone tries to join, works the same way: delays that run past what patients find acceptable produce frustration and cost clinicians time, even on visits that eventually go through. Neither metric is abstract. Both are early warning signs for the service problems covered in the previous section, visible in connection logs weeks before they appear in a satisfaction survey.
These numbers need to be broken out by visit type and modality, video, audio-only, and asynchronous, because connectivity standards and failure modes differ across each one. A blended average across all three can look fine while one modality is quietly failing patients. In hybrid-care settings, technical performance stretches further still, into interoperability: whether data from a remote monitoring device or a pre-visit triage tool actually lands correctly in the visit record. A broken handoff between systems is a technical failure even when the video connection itself works perfectly. Most telehealth platforms already generate connection logs that can surface abandonment rates and connection times without extra tooling. The task for clinic leadership is building the dashboard that pulls these figures out routinely, rather than finding out about a problem only after a patient complains.
Financial performance: what visit volume and reimbursement tell you
Technical reliability is a precondition for financial performance, because a visit that drops mid-session due to a bad connection never generates the revenue the clinic scheduled it for. Visit volume alone is a number without much use. It becomes meaningful only when paired with reimbursement per visit and denial rate, because a clinic can run high telehealth volume and still lose ground financially if coding, modality documentation, or payer mix is mismanaged.
Visit volume and visit reimbursement need to be tracked as separate figures precisely because they can move in opposite directions. A clinic can grow its telehealth visit count while reimbursement per visit falls, if the mix of visits shifts toward modalities or payers that pay less. Volume itself should be reported as completed visits against scheduled visits, not as a raw count, since that ratio is what actually reveals no-show and completion patterns that a bare number hides. Telehealth no-show rates tend to run meaningfully lower than in-person no-show rates, which is a real financial advantage. That advantage disappears, though, if technical failures turn what would have been a low-no-show booking into an abandoned session that still gets logged as completed.
Reimbursement per visit has to be tracked by modality. CMS requires different modifiers for telehealth evaluation and management codes depending on whether a visit is audio-video or audio-only, even though both modalities draw on the same underlying E/M codes and the same payer-set rates under Medicare fee-for-service. Payer mix adds another layer of variation on top of that. A single blended reimbursement average across all modalities will conceal exactly which visit types are actually worth running. Denial rate on telehealth claims deserves its own line in any financial review, because denials in this channel often trace back to modality documentation errors, failing to record that a visit was audio-video rather than audio-only, or to place-of-service coding mismatches. A denial rate that climbs above baseline points to a coding workflow problem, not a volume problem, and treating it as the latter wastes time chasing the wrong fix. Point-of-service collections complete the financial picture by showing what the practice actually collects at the time of the visit, rather than what it expects to collect later through the claims process, and that figure can flag payer mix trouble well before it shows up in accounts receivable aging.
The 2026 extension of Medicare telehealth flexibilities through the end of 2027 is context here. A stable regulatory runway means the financial metrics above can be tracked and compared across multiple years without the benchmark itself shifting underneath the clinic. Knowing what to measure across all three domains is only half the job; a clinic also has to build a process that turns these numbers into decisions.
Building a review cadence for actionable metrics
Metrics that nobody reviews on a regular schedule produce awareness without action, and the right review cadence is not the same across all three domains. Each domain moves at its own speed, and a measurement program that reviews everything on the same calendar will either drown leadership in noise or let a real problem sit unaddressed for months.
Technical metrics, abandonment rate and connection time, need frequent review, weekly or after any high-volume stretch, because technology failures compound fast and the fixes, a platform configuration change or a connectivity upgrade, are usually quick to put in place once identified. Service metrics work better on a different rhythm. Telehealth.org guidance recommends collecting satisfaction data two to three times a year, concentrated over a short window of a few days. That approach avoids survey fatigue, produces richer qualitative feedback, and gives leadership data at a pace they can actually respond to between collection periods. Financial metrics, completion rate, reimbursement per visit by modality, denial rate, and point-of-service collections, fit best in monthly or quarterly operational reviews, the same cadence most clinics already apply to other service lines, because reimbursement and denial patterns need enough visit volume behind them to separate a real trend from noise.
None of this works without ownership. Technical performance should report to the operations or IT lead, service performance to the clinical quality lead, and financial performance to the revenue cycle or practice management lead, each with a defined escalation path when a metric crosses its threshold. Without a named owner attached to each domain, a dashboard stays a reporting artifact that gets glanced at and forgotten. The review process itself should disaggregate by clinician, specialty, and patient subgroup at least quarterly, since a practice-level score that looks acceptable can still be hiding one specialty or one population segment where performance is genuinely failing. Clinics just starting to measure telehealth formally should resist the urge to set targets before they have a baseline. Establishing baseline data across all five core metrics first is what makes any later benchmark meaningful, and the baseline itself usually points directly to whichever problem deserves attention first.
Where aggregate metrics hide problems: disaggregation and equity-aware tracking
Every domain covered above carries the same risk at the aggregate level: a number that looks acceptable practice-wide can still be concealing a population or a segment of the operation where things are going wrong. Patient satisfaction scores need to be broken out by age, language, insurance type, and geography, because a clinic serving a mixed population can post a comfortable average while a specific group of patients consistently struggles to complete a visit without technical difficulty. The same logic applies to clinician satisfaction across specialties, to technical performance across visit modality, and to financial metrics across payer mix. A blended number is, by construction, built to hide variation, and variation is often exactly where the operational problem lives.
This is why the review cadence described above calls for disaggregation by clinician, specialty, and patient subgroup at least quarterly, not as an optional refinement but as a standard part of the process. A clinic that only ever looks at practice-wide averages will catch a crisis late, after it has already affected enough patients or clinicians to move the aggregate number. A clinic that disaggregates routinely catches the same problem while it is still contained to one segment, one modality, or one specialty, when the fix is still cheap and fast. The three-domain framework gives clinic leaders the categories. Disaggregation is what makes sure the numbers inside those categories are telling the truth about who is actually being served well, and who isn't.
Sources
- Development of key performance indicators for a telemedicine setting in Egypt using an electronic modified Delphi approach - PMC
- 5 Critical Metrics for Telehealth Success - Ingenium Digital Health Advisors
- How to Measure Telehealth Success - Ingenium Digital Health Advisors
- Development of key performance indicators for a telemedicine setting in Egypt using an electronic modified Delphi approach
- How 2026 E/M and Telehealth Rules are Changing